Idle noise, ROR intervals, and analyzing roast curves - a podcast by Scott Rao
from 2019-07-04T23:42:04
Idle noise, ROR intervals, and analyzing roast curves
Recently, Marko Luther of Artisan published a fascinating blog post “On Idle Noise.” Marko’s post discussed how to diagnose and fix “idle noise,” or background noise present in one’s data collection and processing when using Artisan. Marko offered a simple test of noise by data logging bean-probe readings with a roasting machine off and with its motor on (with no beans in the machine). I’m pleased to have inspired part of Marko’s post and to also recognize him here for his brilliant work. Please read the post and do his idle-noise test on your machine .
Marko’s post is a little complicated, so I’d like to show a few simple curves illustrating various levels of bean-data noise and software smoothing of the noise. It is a little easier to see excessive noise in Artisan than in Cropster, so I will focus on Artisan curves here.
A few definitions before we begin: in each of the next few curves, there is a box on the left containing various settings. All of these curves had the following settings:
Sampling interval: 1. Sampling interval is the amount of time between each point of data collection from the probe. For instance, a sampling interval of three seconds means that the software asks for data from the probe every third second. Here I have set the sampling interval to one second; Marko recommends three seconds. I used 1s to match the default sampling interval of Cropster, in order to help Cropster users better relate to these curves .
Smooth Curves/ Smooth Deltas: 0 I have set these to 0 in order to not artificially smooth the data. (Other than via the delta span.)
Delta Span: 1s or 15s Each curve is shown with the shortest (1s) and longest (15s) delta spans Artisan offers. The delta span is the time interval over which the ROR is calculated. In other words, any given ROR reading is the average of , respectively, the last one second or fifteen seconds of data. Longer delta spans make curves look smoother. Delta span is what Cropster calls ROR Interval.
Here is an ROR curve derived from very noisy data, with the delta span set to 1s and 15s. Note the intense vertical spikes in the 1s delta-span view; they are telltale signs of data noise.
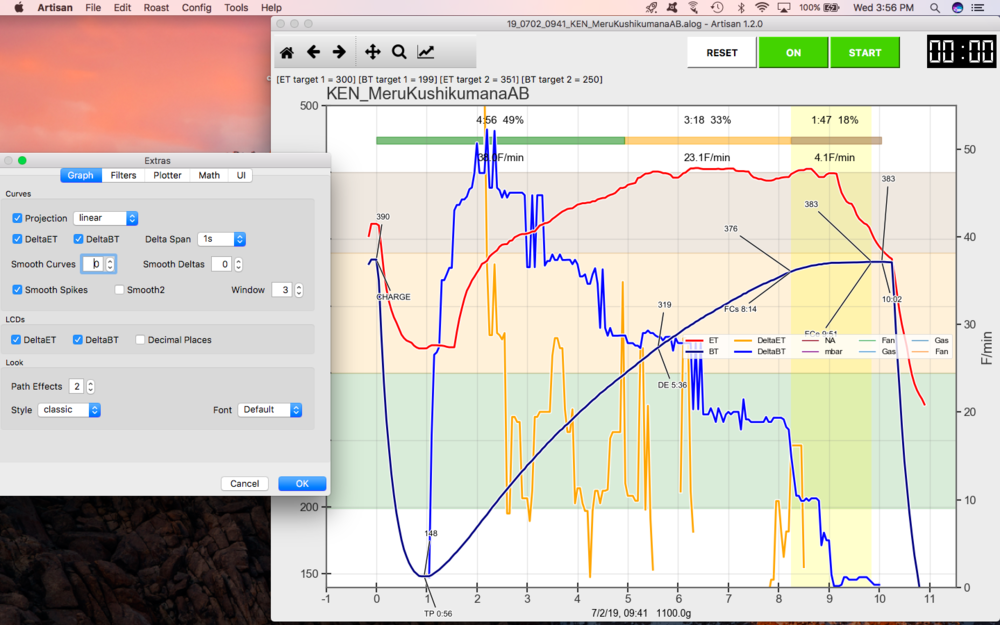
Delta span of 1s: Note the spikes in the blue (ROR) curve. This is very noisy data.
Side note: you will rarely, if ever, see noise like this in Cropster. It’s not because the noise isn’t there, but because Cropster uses a different smoothing algorithm from Aritsan’s. Each system has its pros and cons.
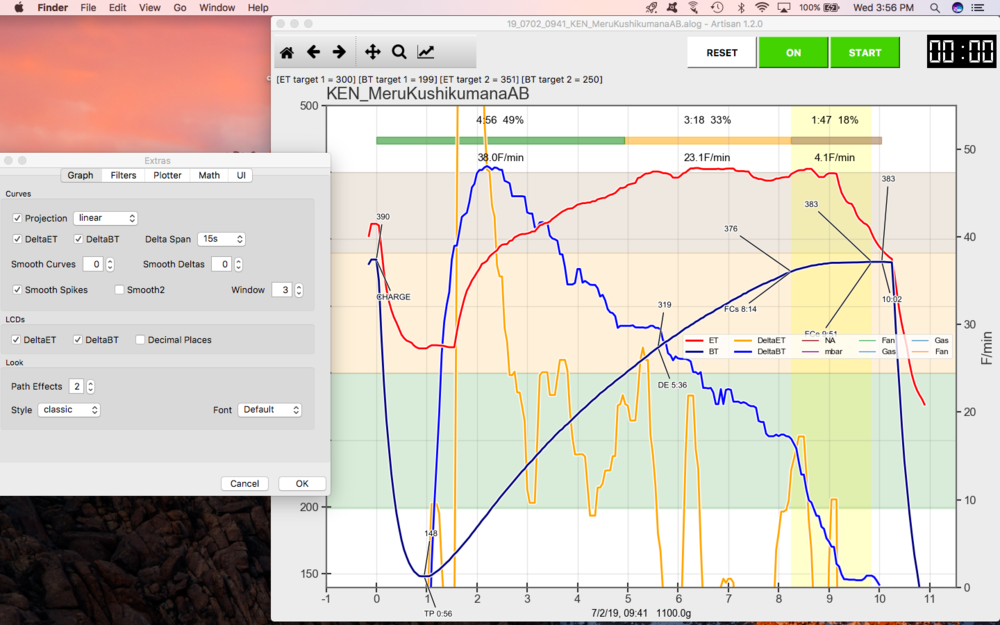
Using 15s delta span artificially smooths the data from that same curve. This makes it easier to analyze (and helps roasters sleep better at night.)
The curves below are from a system with relatively little idle noise, shown in the 1s and 15s delta-span views again:
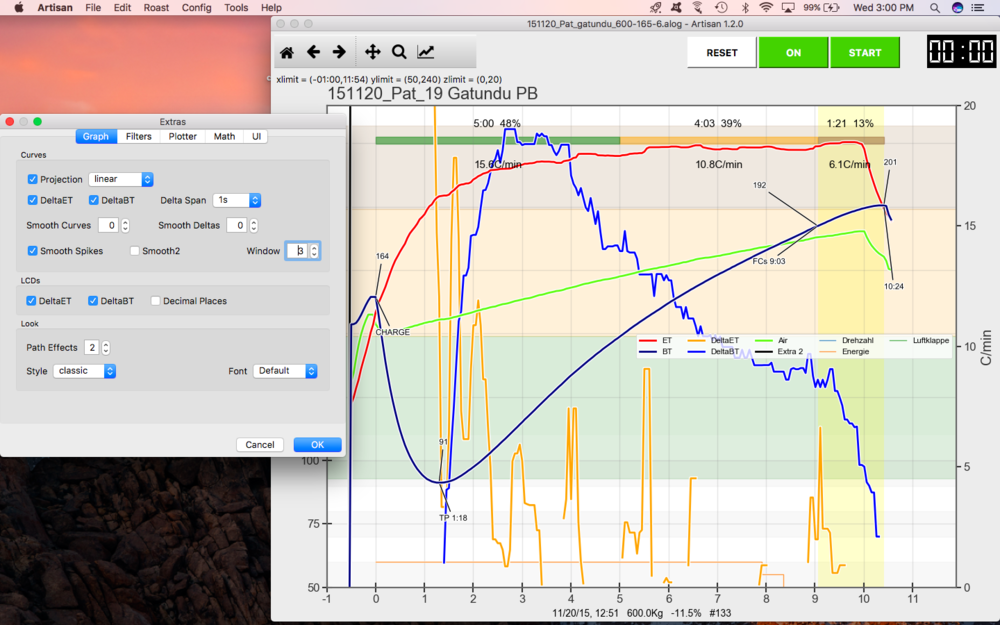
Delta span of 1s: Noisy and spiky but far less so than the Delta span of 1s: Noisy and spiky but far less so than the previous example with the 1s delta span.
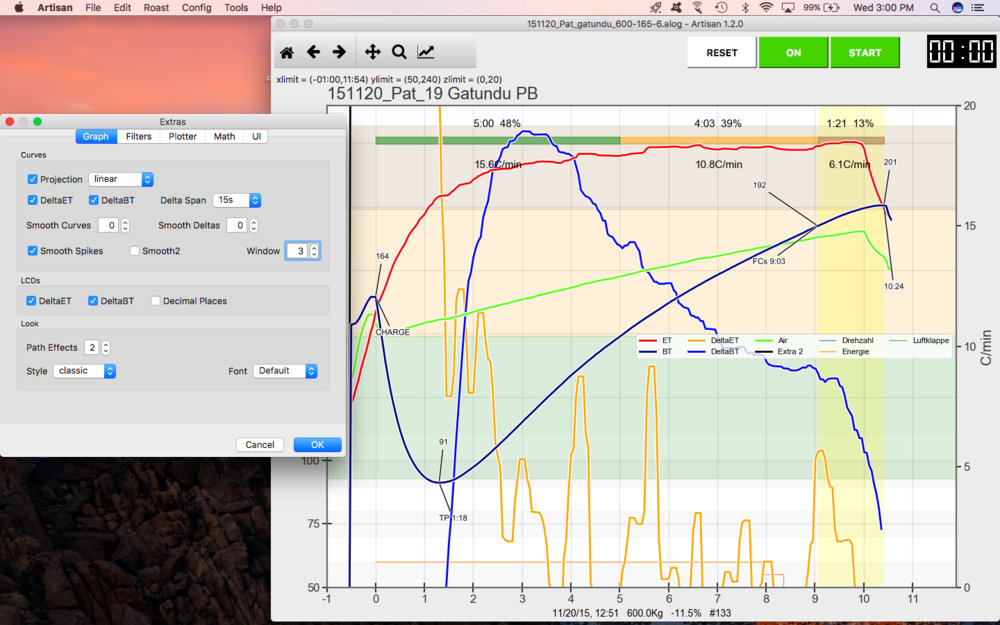
Low-noise, high-quality data at 15s delta span
The Bottom Line
There is no universal set of optimal settings. You must customize the settings for your probe’s responsiveness, the level of background noise, and the software you use. Of course, you should attempt to minimize background noise and use the lowest practical delta span or ROR interval.
NB: Even if you don’t see obvious spikes in your ROR data, you may still have a serious problem with idle noise.
How to optimize software settings to analyze past curves
There are two types of data analysis I do on a roast curve: looking for a trend and looking for an event. By trend, I mean the shape, or changes in shape, of an ROR curve over a period of time. An event refers to a point in time, such as when an ROR crash or flick began. When looking at trends, i’ll make use of a higher ROR interval and when looking at events, I’ll typically use a lower ROR interval. .
Events
Let’s look at an event —an ROR crash— in Cropster. Cropster and Artisan calculate ROR curves differently, and at this time Crospter’s ROR-interval options range from 10s to 60s; quite a bit higher than those of Artisan. In this case, we’ll use a 10s ROR (the lowest in Cropster) to determine as precisely as we can when an ROR crash occurred.
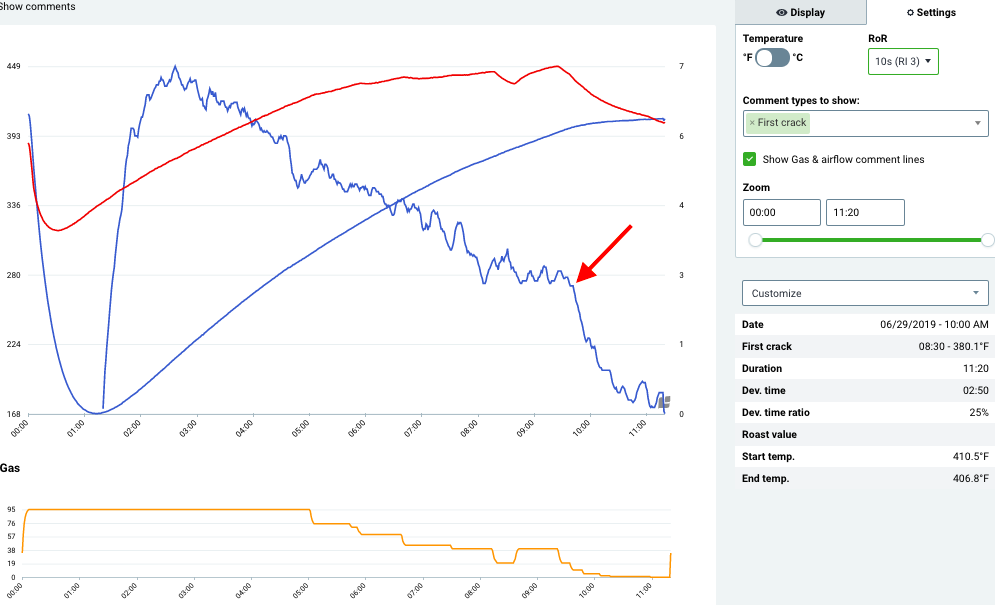
The red arrow indicates the beginning of an ROR crash. Viewing such an event in the 10s ROR view can help a roaster more precisely determine how to time gas settings next time to prevent the crash.
Here’s an example of looking at a trend in Cropster, looking at the same curve with a 30s ROR interval:
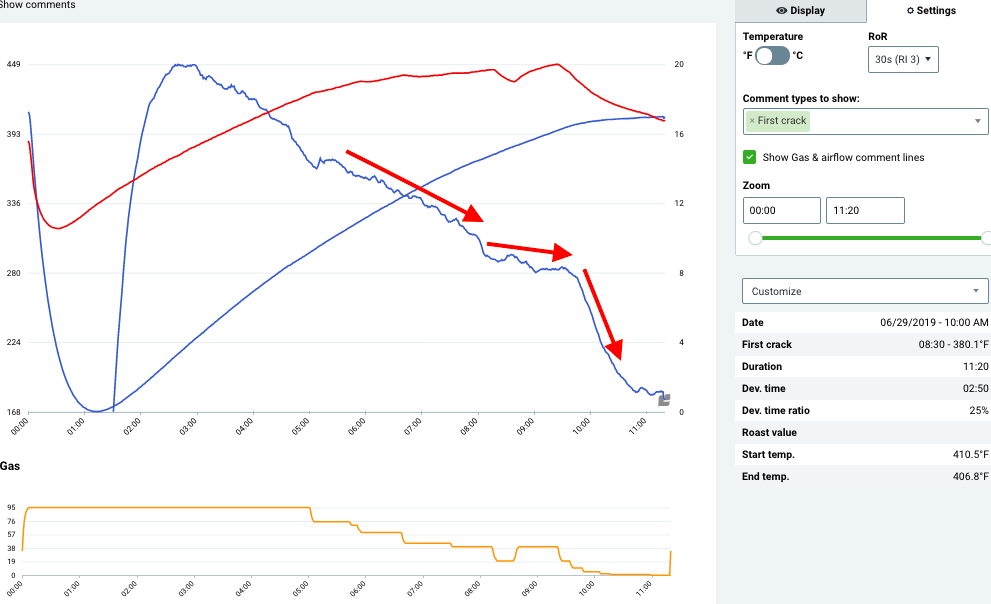
The arrows approximate the ROR’s slope at various parts of the roast. It’s easier to discern a trend such as an ROR slope in the 30s ROR view than in a shorter interval such as the 10s view.
Another event you may look for in a completed curve is the beginning of first crack. Here is an example of using a 10s ROR interval in Cropster to decide the precise beginning of first crack
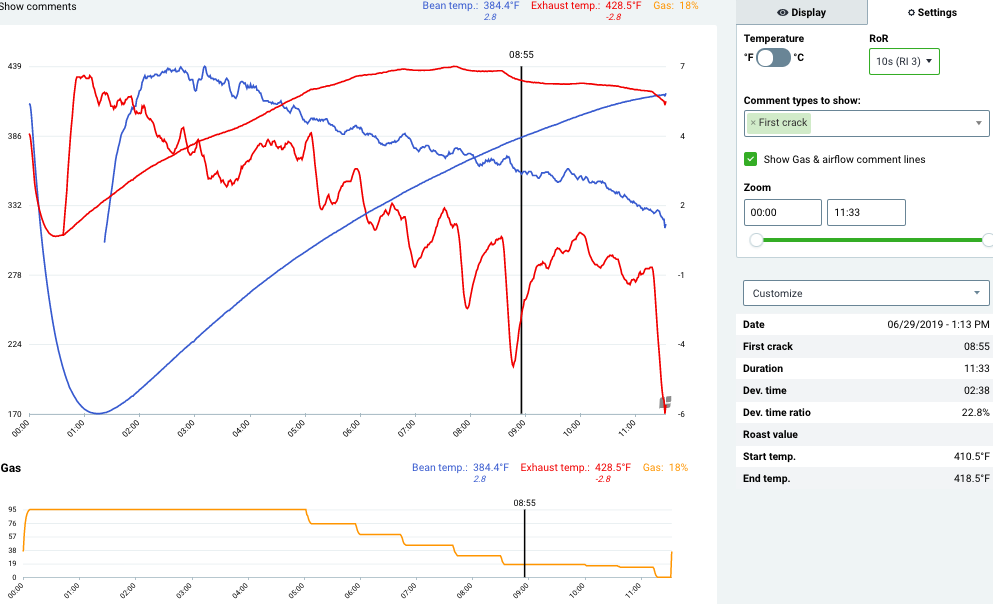
Note that the roaster chose to mark first crack after the ETROR trough. If the trough seems to have been triggered by a decrease in gas, it is sometimes sensible to mark first crack after the trough. Details on this some other time.
Further episodes of Q
Further podcasts by Scott Rao
Website of Scott Rao